

Indicators for any territory
They are available from the municipality to the département and from the IRIS (INSEE neighborhood unit) to the inter-municipal authority (EPCI). Vectorive processes the data upstream.
Self-service Geo Data Intelligence. Map Analytix turns open data and proprietary data into indicators, scores and presentation-ready reports.
It is a single platform for local authorities, housing, energy, insurance, franchising and logistics.
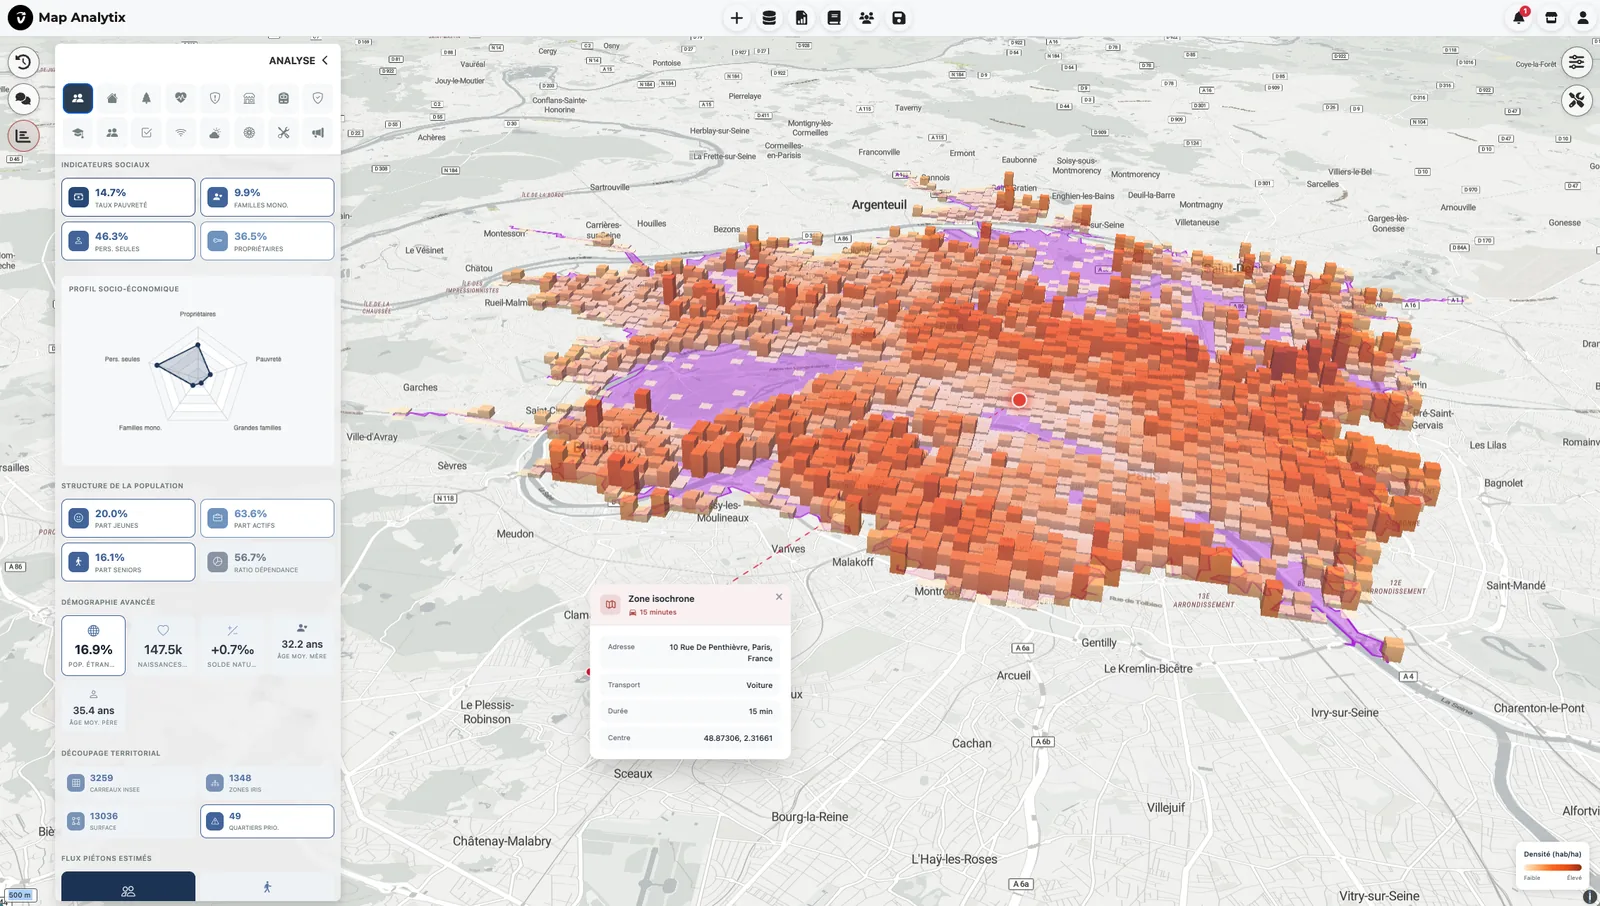
What you get
With Map Analytix, the data is prepared in advance. You open the platform, choose a territory and read the result.
They are available from the municipality to the département and from the IRIS (INSEE neighborhood unit) to the inter-municipal authority (EPCI). Vectorive processes the data upstream.
They are grouped into ten themes, from demographics and retail to risk and health. They are built by cross-referencing more than 150 official sources.
Draw walking, drive-time or cycling isochrones from 5 to 30 minutes. Compare up to ten zones on the same map.
Filter territories by your criteria, down to the IRIS level. See the result on the map immediately.
You can edit it in the platform and apply your organization’s branding.
Each indicator is produced by a deterministic process. It carries its source and its reference year.
The platform
Here are the screens that make up the analysis, in the order you go through them.
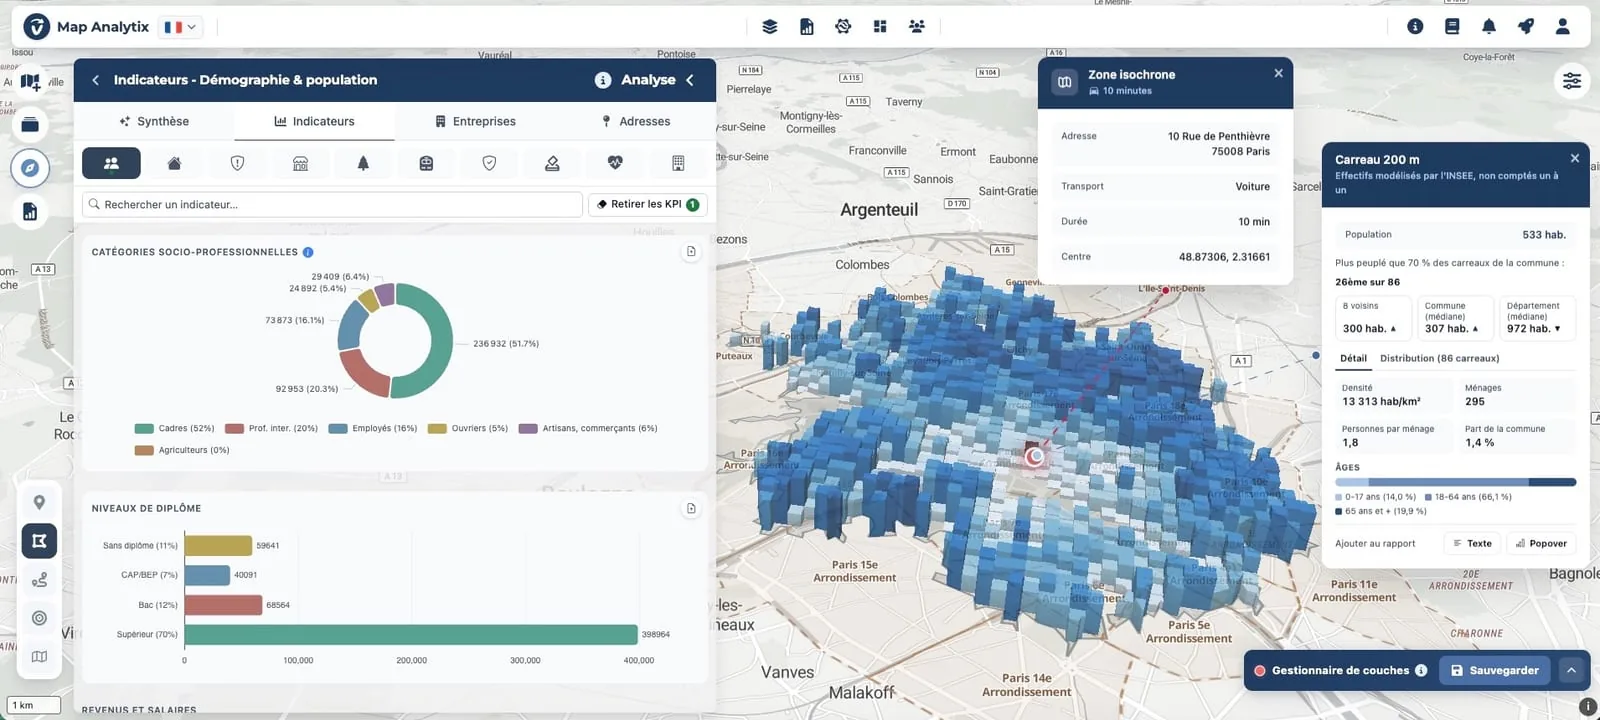
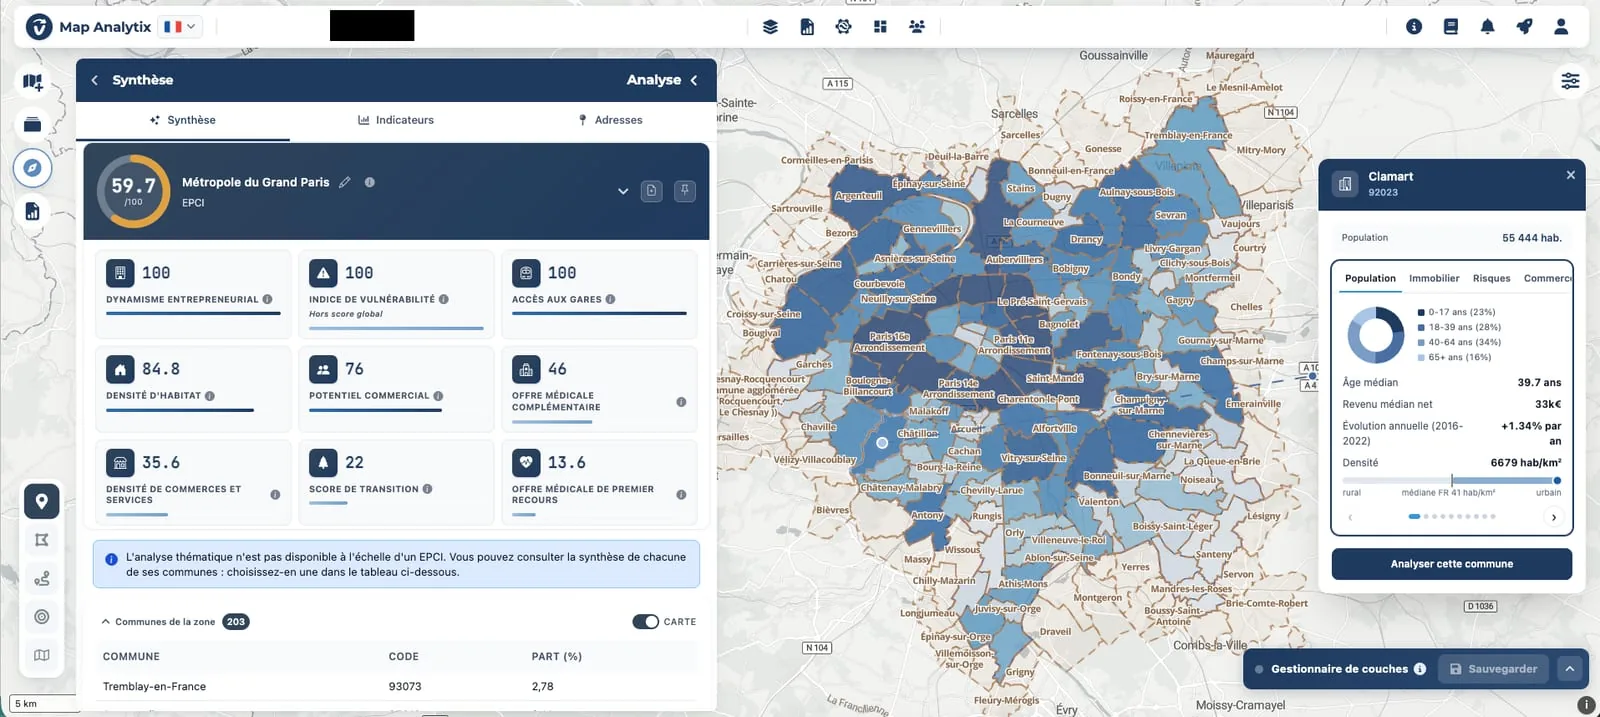
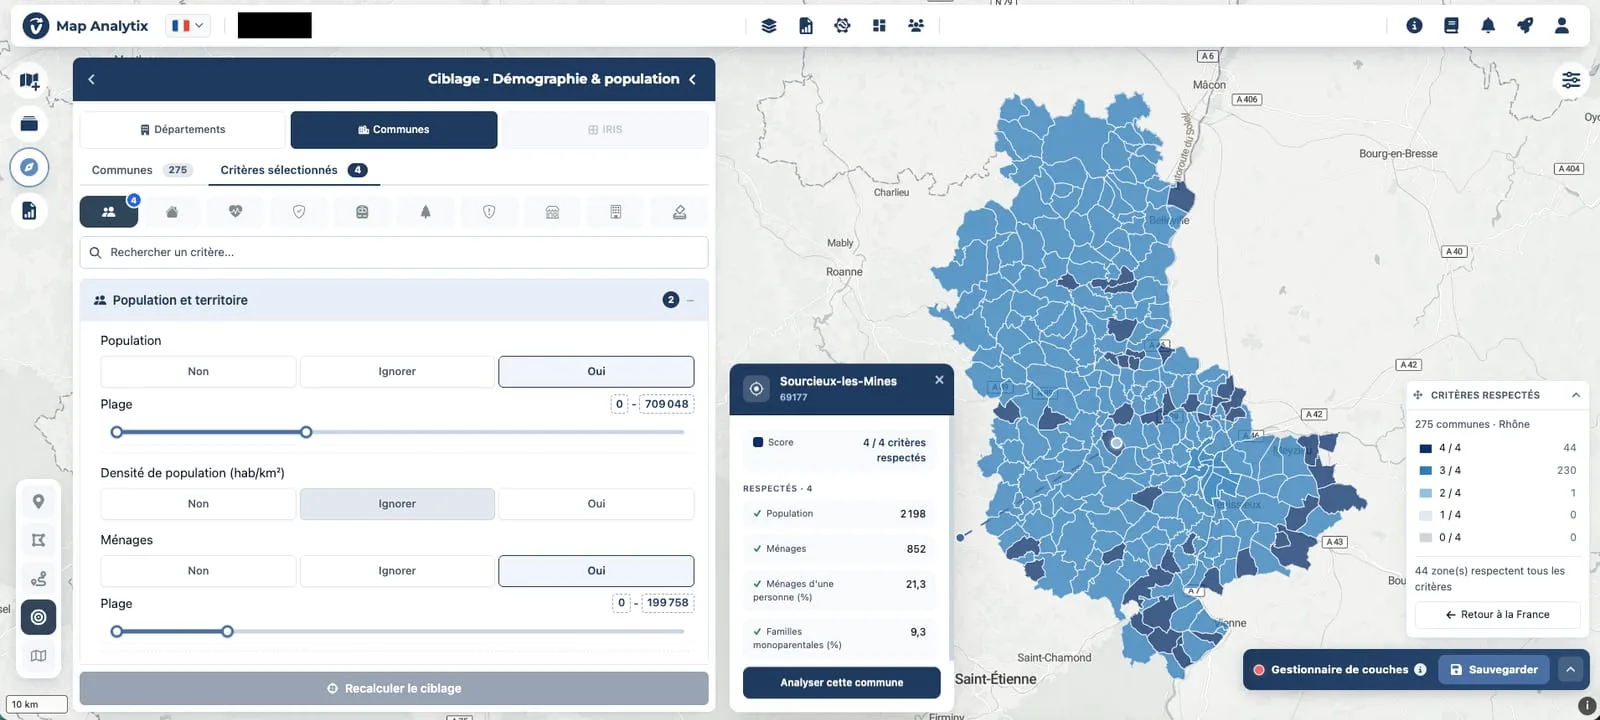
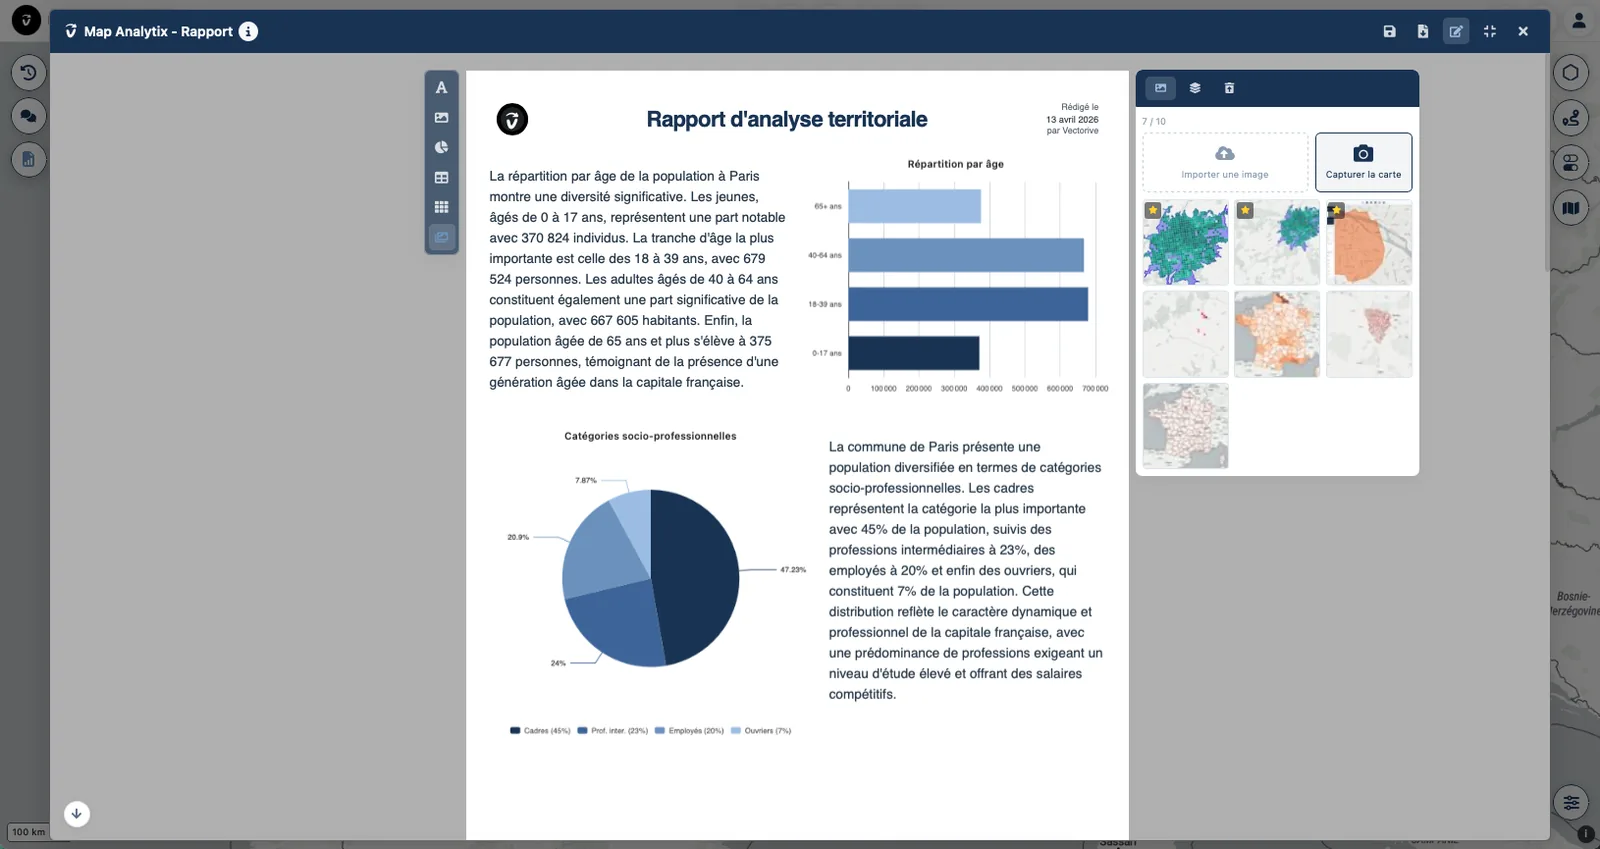
Zone analysis: Draw a zone by travel time, address or perimeter. Its indicators are organized by theme. Click any 200 m grid square to see how it compares with its neighbors, the municipality and the département.
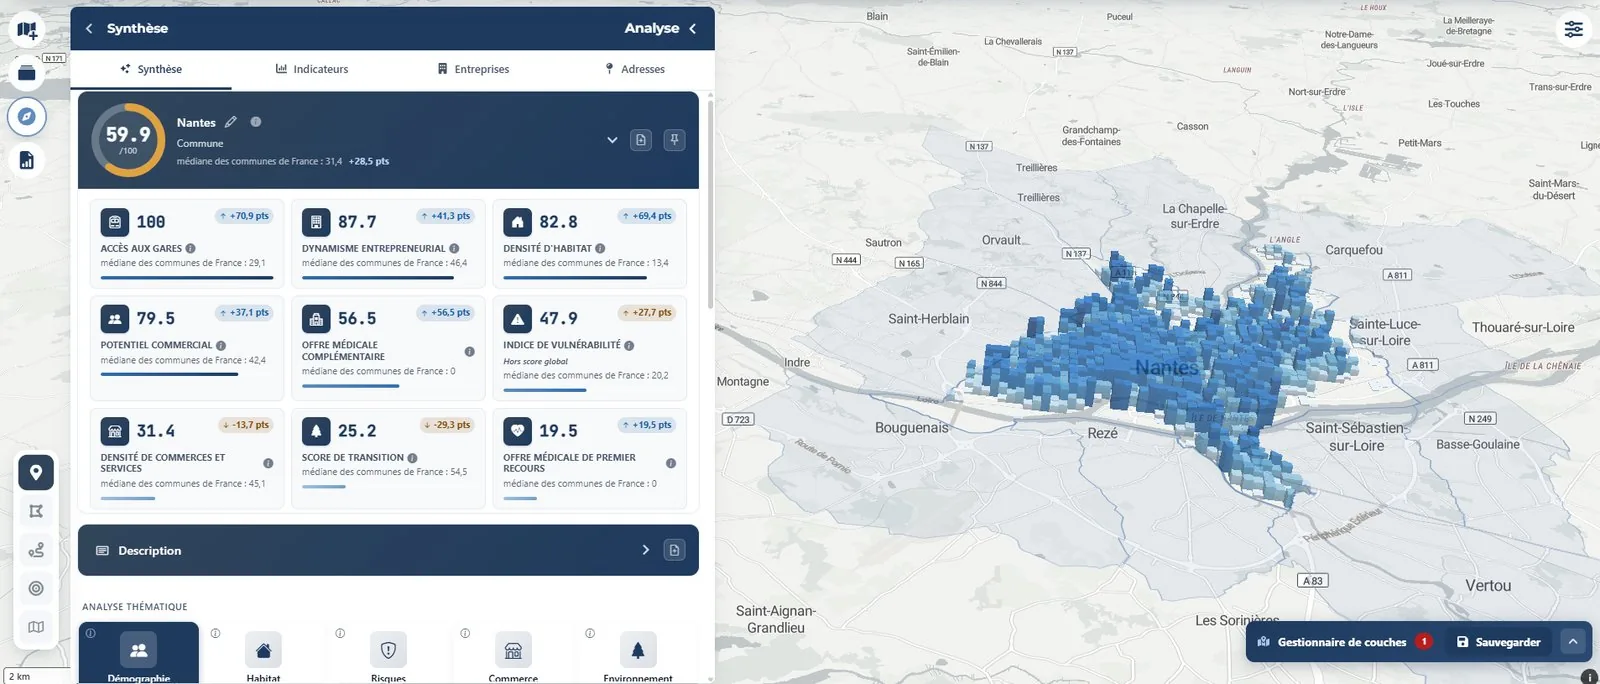
Summary: The summary of a territory gives an overall score out of 100 and its sub-scores, each compared with the median of French municipalities. The map of 200 m grid squares stays in 3D.
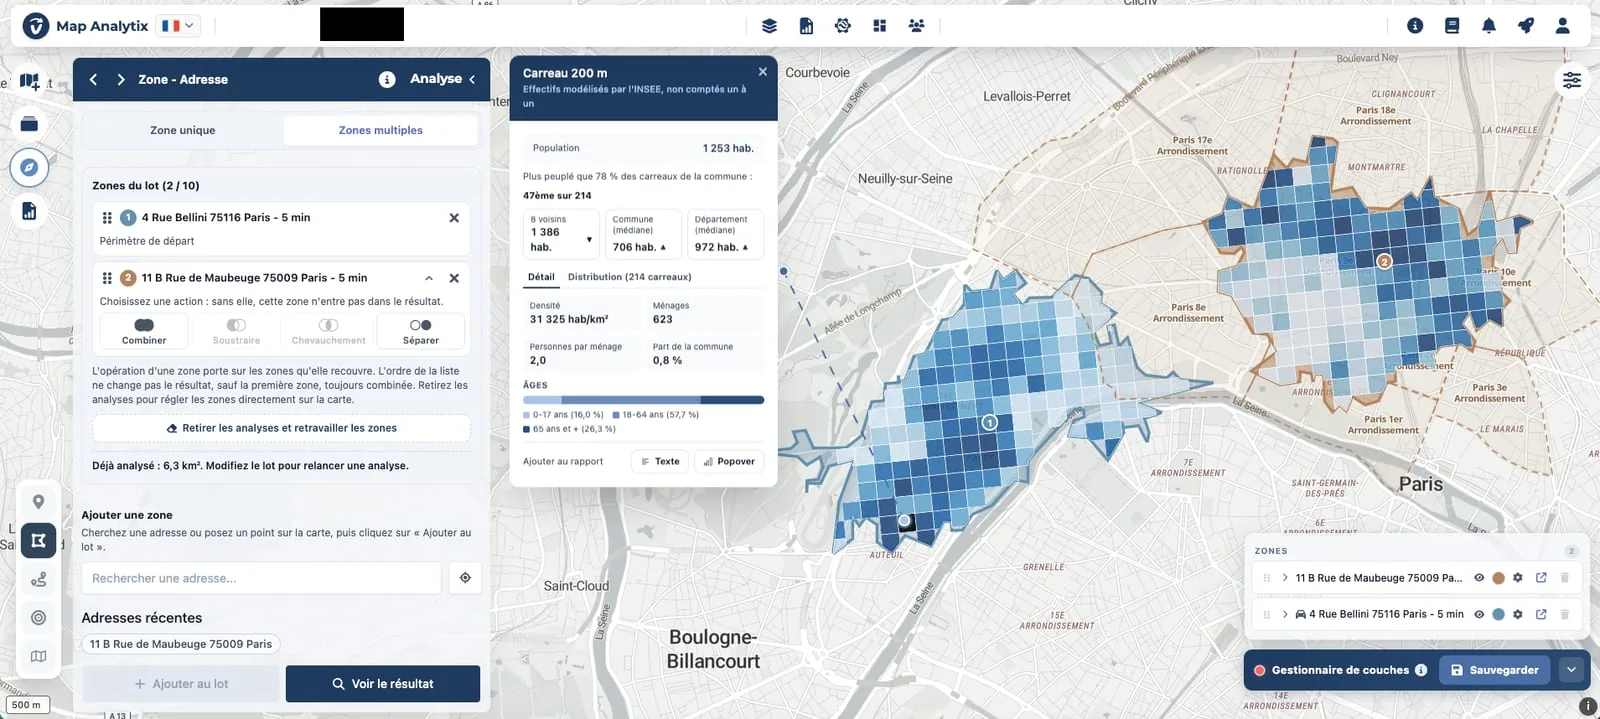
Comparison: Place up to ten zones on the same map, by address, travel time or municipality. Combine them and compare them indicator by indicator, down to the 200 m grid square.
EPCI analysis: Choose an inter-municipal authority (EPCI) to see an overall score out of 100, the map of its municipalities and a profile for each one. Open a municipality to analyze it in detail and compare it with the others.
Targeting: Describe your criteria, from demographics to real estate or energy. The platform colors the matching territories at the scale of your choice, down to the IRIS level. Every result can be checked, figure by figure.
Report: Your analyses become a structured report on the same platform. You add, reorder and refine each section to match your visual identity. The report is ready to present, with PDF export included.
Trade area
Map Analytix draws the trade area of a retail location as walking, drive-time or cycling isochrones from 5 to 30 minutes. You can read its indicators immediately, down to the 200 m grid square.
For a franchise network, this is how the local market study under the French Loi Doubin comes together in a few minutes, with the network’s branding.
One platform for several sectors
Map Analytix covers local authorities, housing, energy, insurance, franchising, retail and logistics. Each sector has its own indicators and vocabulary, built on a common data foundation.
A controlled data chain
Vectorive processes the data upstream: national open data, proprietary data and large data volumes. Map Analytix is the visible part. It complements your GIS tools and the work of your GIS specialists.
Open data, proprietary data and large volumes.
Engineering, quality checks, data dictionaries and a semantic layer.
Deterministic processing prepares every indicator.
Map Analytix as a self-service platform.
Indicators, scores and sourced reports.
AI agents dedicated to analyzing buildings step in after the data has been collected and quality-checked. The calculations remain deterministic.
Frequently asked questions
Map Analytix is Vectorive’s self-service Geo Data Intelligence platform: more than 300 indicators across ten themes, drawn from more than 150 official sources, with pre-computed analyses covering all of France down to the 200 m grid square.
You draw the zone by travel time, from 5 to 30 minutes on foot, by car or by bike. You can also define it by address or by perimeter. Its indicators are organized by theme right away. You can compare up to ten zones on the same map.
Map Analytix covers all of France, from the municipality to the département and from the IRIS (INSEE neighborhood unit) to the inter-municipal authority (EPCI). Its pre-computed analyses go down to the 200 m grid square.
Map Analytix cross-references more than 150 official sources and more than 20 million indexed addresses, processed upstream by Vectorive. Each indicator is produced by a deterministic process: it carries its source and its reference year.
No. Map Analytix complements your GIS tools and the work of your GIS specialists. The data is prepared in advance: you choose a territory and read the result.
Map Analytix plans and their pricing are listed on mapanalytix.ai.
View Map Analytix pricingMap Analytix has its own website and its own demo.