
Skip to content

Projects

Successful projects at the intersection of data, geospatial analysis and AI

Data engineering, data analytics, AI agents, geospatial analysis and Geo Data Intelligence: our teams combine these areas of expertise to deliver environments that support decision-making, from national programs down to individual buildings.

Expertise across projects 14 projects

Case studies

Our projects in Data Engineering, BI, AI agents and Geo Data Intelligence.

Filter by area of expertise to see how our teams combine these areas from one project to the next.

14 projects shown

  • Geo Data IntelligenceNationwide coverage

    Map Analytix: every territory in France analyzed

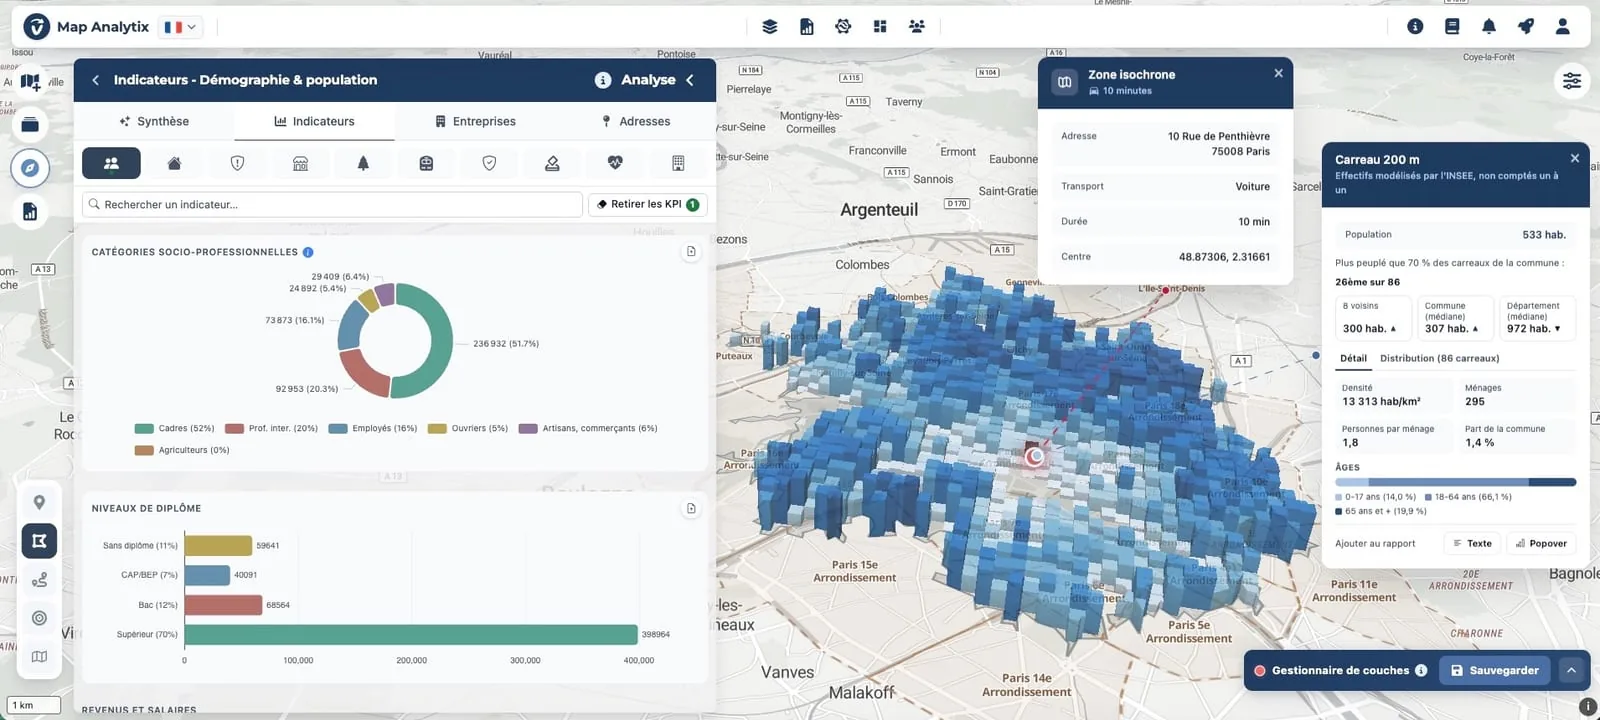
    More than 300 indicators across ten themes are built by cross-referencing more than 150 official sources and 20 million indexed addresses. The analyses are pre-computed down to the 200 m grid square. They become a report that is ready to be shared.

    • Geo Data Intelligence
    • Geospatial analysis
    • Data Engineering
    • Data Analytics
    Discover Map Analytix
    Map Analytix: analysis of an isochrone zone with its indicators and the 200 m grid squares
  • Local authoritiesTerritorial diagnosis

    Territorial diagnosis for housing programs and climate plans (OPAH, PLH, PCAET)

    Ten themes and a territorial score out of 100 are built on sources from INSEE, BDNB, ADEME and DGFiP. The diagnosis is produced in a few days and serves as a working tool for planning firms.

    • Geo Data Intelligence
    • Geospatial analysis
    • Data Analytics
    Map Analytix for local authorities
  • HousingEvery building in 3D

    Data on every building, viewed on a 3D map

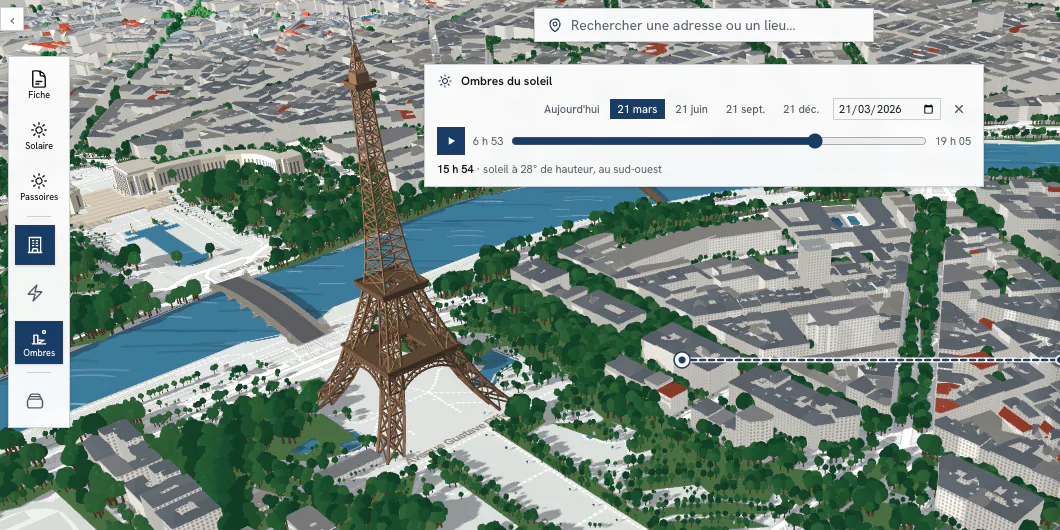
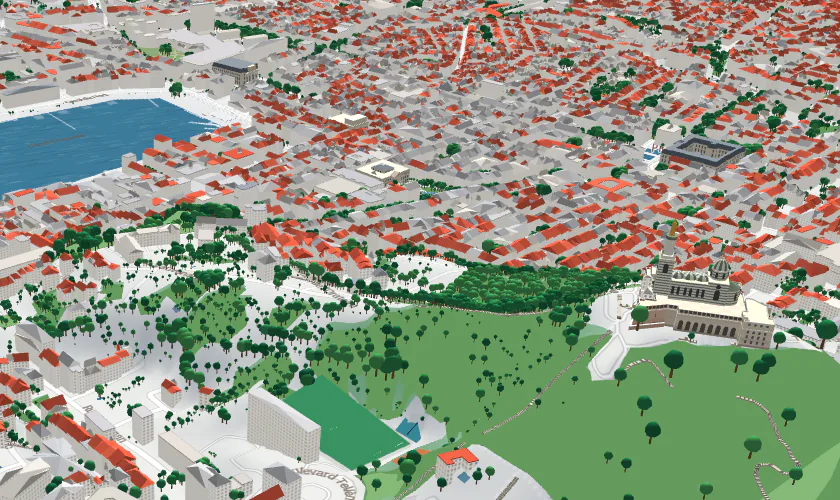
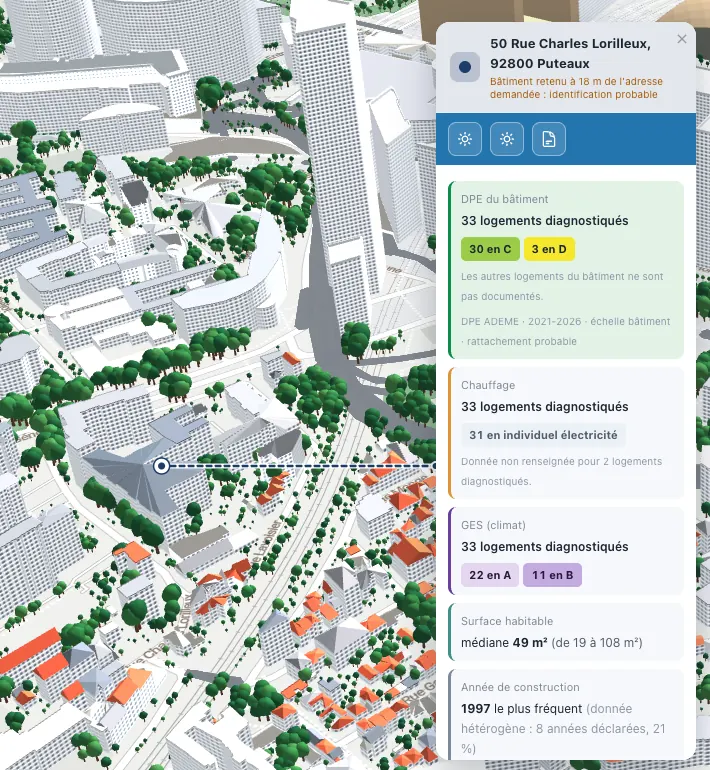
    As an extension of the geospatial analysis, the 3D map describes each building by its height and the material of its roof. It also shows trees mapped by LiDAR, green spaces, water and monuments. Clicking a building brings up its energy performance certificates, climate labels, heating system, floor areas and year of construction. Two views identify energy-inefficient homes and the solar potential of roofs. A third shows the shadows cast by the sun on any date of the year and at any time of day. The map follows the terrain, as it does in Marseille all the way up to the hill of Notre-Dame-de-la-Garde. The municipality under study has its own energy profile. A building’s fact sheet gives the electricity consumption recorded at its address, when Enedis publishes it.

    • Geospatial analysis
    • Geo Data Intelligence
    • Data Engineering
    Map Analytix for housing
    3D map around the Eiffel Tower on March 21 at 3:54 p.m.: shadows cast by buildings and trees, with the panel that sets the date and time and gives the elevation and direction of the sun
    3D map of Marseille with its terrain: the Notre-Dame-de-la-Garde basilica on its hill, the Old Port, the trees and the roofs colored by material
  • Fact sheet for a building in Puteaux on the map: 33 homes with an energy diagnosis, energy performance (DPE) and greenhouse gas (GES) labels, heating, living area and year of construction
    Private housingBuilding scale

    A building fact sheet produced by AI agents

    A building’s fact sheet brings together property sales and prices per m², energy and climate labels, heating, floor area, construction period and solar potential. Dedicated AI agents produce it once the data has been collected and quality-checked. The calculations remain deterministic. The fact sheet flags when the link between an address and a building is only probable.

    • AI agents
    • Geospatial analysis
    • Geo Data Intelligence
    • Data Engineering
    • AI and data infrastructure
    Agentic AI for housing in Map Analytix
  • Housing and renovationNational program

    Managing the national housing stock

    A complete processing and visualization environment is used to steer national housing and energy renovation programs. Semantic dictionaries, RAG on business data, consolidated dashboards and analytical models work together.

    • Data Engineering
    • Data Analytics
    • Semantics and RAG
    RAG with Data Fabrik
  • EnergyLeading operator

    A data and AI environment for the energy sector

    We operate a data platform built around the business challenges of an energy operator. Open source tools, models and semantic RAG run on our infrastructure. The platform integrates business sources and consolidates reporting.

    • Data Engineering
    • Data Analytics
    • Semantics and RAG
    • AI and data infrastructure
    The Data Fabrik environment
  • Mutual insuranceNational player

    A Data Fabrik environment dedicated to an insurer

    A complete processing and visualization environment addresses the insurer’s business issues. The open source stack, the semantic layer and operational reporting work together within it.

    • Data Engineering
    • Data Analytics
    • Semantics and RAG
    Discover Data Fabrik
  • HealthcareLeading hospital

    Structured and sovereign hospital data

    A data and AI environment organizes the hospital’s data by business area. It relies on semantic dictionaries and on hosting in France.

    • Data Engineering
    • Semantics and RAG
    • Data Analytics
    • AI and data infrastructure
    The scope of Data Fabrik
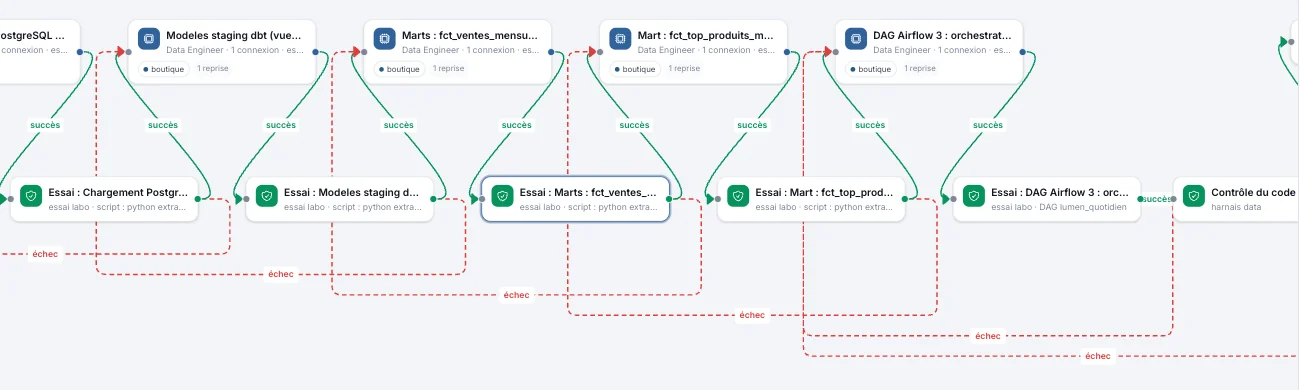
  • Pipeline of a dbt and Airflow project taken over by AI agents: loading, staging models, marts and the Airflow DAG. Each step is followed by a test run in the lab, shown in green when it succeeds and in red when it fails
    Agentic Data EngineeringTaking over dbt and Airflow projects

    A dbt and Airflow project taken over, migrated and refined by AI agents

    AI agents take over an existing dbt and Airflow project, migrate it and then refine it. Each step goes through a test run in the lab and then a check before it is deployed. The pipeline extends all the way to the delivered data marts and OLAP cubes. AI agents also create new pipelines, starting from an existing project or from the client’s statement of requirements. Our experts translate these requirements into precise tasks and see the project through to production.

    • AI agents
    • Data Engineering
    • Data Analytics
    • AI and data infrastructure
    Data Agentic in Data Fabrik
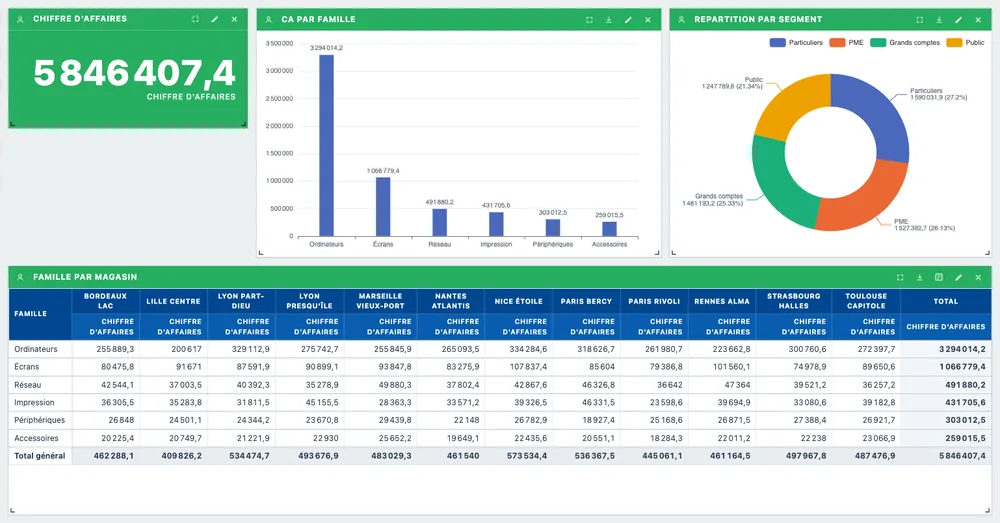
  • Report Analytix: dynamic report with a key indicator, charts and a pivot table
    AnalyticsAI agent-driven BI

    Report Analytix: cubes and reports designed by AI agents

    The AI Architect agent builds the cube, the AI Data Agent designs the complete report and the expert validates it. On a demo cube, the plan for a complete report is ready in 57 seconds and a cube of 3 million rows is built in 14 seconds.

    • AI agents
    • Data Analytics
    • Data Engineering
    • AI and data infrastructure
    Discover Report Analytix
  • Healthcare for professionalsData and services group

    A data platform for healthcare offerings aimed at professionals

    Governance, semantics and consolidated reporting serve the group’s internal use cases as well as those of its clients.

    • Data Engineering
    • Data Analytics
    • Semantics and RAG
    Semantics with Data Fabrik
  • HealthcareNational platform for professionals

    From ingestion to reporting for healthcare professionals

    A data and AI environment covers the entire chain: ingestion, quality control, analysis and reporting.

    • Data Engineering
    • Data Analytics
    The Data Fabrik offering
  • DocumentsHigh volume

    Multimodal document processing

    Invoices, contracts and case files: Vectorive has mastered their multimodal processing. This capability applies to use cases with high document volumes.

    • Document AI
    • Data Engineering
    • AI and data infrastructure
    Discuss a document project
  • Franchises and networksLocal market study

    A local market study in a few minutes

    Travel-time trade area, population, competition and market potential: the local market study under the French Loi Doubin is built in a few minutes with the network’s branding.

    • Geo Data Intelligence
    • Geospatial analysis
    • Data Analytics
    Analyze a trade area

Our expertise

Eight areas of expertise that we bring together.

A successful project almost always combines several of them. Our experts coordinate them from start to finish.

  • Data Engineering

    Ingestion, quality, models and orchestration: reliable data that is ready to use.

  • Data Analytics

    Multidimensional cubes, dashboards and dynamic reports for decision-making.

  • AI agents

    AI agents design pipelines, cubes and reports under the control of our experts.

  • Semantics and RAG

    Data dictionaries and RAG connect AI to the business meaning of your data.

  • Geospatial analysis

    Geocoding, isochrones and 200 m grid squares to understand every area.

  • Geo Data Intelligence

    Territorial indicators, scores and reports to decide where to act.

  • Document AI

    Multimodal reading of invoices, contracts and case files in high volumes.

  • AI and data infrastructure

    GPU servers, CUDA configuration, LLM and machine learning models operated on our infrastructure.

Awards and talks

Our work is recognized by the data community.

  • Data and AI Innovation MedalNuit de la Data 2023 · geospatial analysis
  • Work presented at GeoData DaysMarseille, 2025
  • Talk at ODSC (Open Data Science Conference)Boston, 2026

Clients who have trusted us

ANAH
ENGIE
MACIF
American Hospital of Paris
Cegedim
MAIIA
EPSA

Let’s talk about your next project.

A 30-minute conversation is enough to assess your needs and judge whether we are the right team.